Artificial Intelligence Will Not Always Replacing Human Workers

Did you ever contact customer service and fed up with them because it seems they do not understand your question but still answer politely and not even try to understand your problems.

Wasting time, isn’t it?

Customer services act like robots because they are being a textbook. Answer any question just based on their textbook. Or maybe only for difficult questions that they don’t understand. They choose to be a textbook rather than say nothing or apologize because they don’t have answer to your question yet.

How if the human customer service skill combine with the robot customer service such as ChatGPT? Will it be better?

ChatGPT is a generative Artificial Intelligence in form of chatbot. It has capability to provide answers to any questions depend on the data and information it can read.

Human customer service can ask ChatGPT for help when they don’t have any answer on their mind to customer’s question. So, when a customer asks for a question, they can also open AI chatbot to find solution. At least they can give make sense answer.

This solution can be used for IT technical supports as well, where usually the job is more difficult than general customer service.

IT technical support will need investigation to understand problems. So, it will take some times to collect information from their users and after that find solution to fix the problem. In general, it will need basic IT knowledge to do the job and especially on the IT domain specific to what they support. They will need to be trained to master the skill and also some experiences.

A company that its business provides technical support in software administrative to other companies, decided to adopt an earlier version of OpenAI’s ChatGPT to improve the performance of their tech sup agents that based primarily in the Philippine, but also in US and other countries. Of course they use their own data to train the machine so it can provide correct information to help the tech sup agents.

As tech sup of certain software, someone has to understand how the software works and how to solve problems. Their skill should improve time to time. But, in reality this job is not that easy, especially for beginners. Seems it’s stressful job and there’s high turnover causing the company had to train new staff again and again.

By implementing chatbot, such as Chatgpt, they can overcome the situation. The staff could improve their performance better, less stress, and customers also happy with their service.

That a sample where AI implementation is not always replacing human workers but help human workers do their job.

We are, human, much smarter than robots, so there will always jobs for us.  (VRGultom)  

Ref:    https://www.npr.org/sections/money/2023/05/02/1172791281/this-company-adopted-ai-heres-what-happened-to-its-human-workers

https://www.kompasiana.com/vrgultom/6452a76e4addee554f1410a2/implementasi-ai-tidak-harus-menggantikan-manusia

The Power of Dimension Attribute in TM1 Data Modeling

There are three types of attributes in TM1 which are alias, string, and numeric. We can use this attribute to simplify rules formula, turbo integrator, data searching, or data grouping on data presentation from TM1.

Attribute in TM1 is attached to element. We can attach the attribute on every element on dimensions or only certain elements, depend on the requirement on TM1 data modeling.

Alias

Alias is another name for the element name. We can swap between element name and the alias easily. As another name for the element, alias is unique, so we cannot use one alias name for two or more different element.

If we do not put alias name for one element, automatically the element name itself become the alias name.

This alias helps business users to choose which name familiar to them when they do analyzing.

For example there is list of product contain code and description. We can put the list of code as elements while description as alias. With this alias we can present data using code or using description, depends on with whom we talk.

Text

Text is referring to data type for the attribute. The content of this attribute will be in text format. This attribute is different from alias. It is not unique, where one attribute can be used for many elements.

We can use it as flag, to indicate the element is group of something, to exclude/include in certain calculations, and to be used in some other conditions.

For Example, we have some elements that group into one name. We can identify the member of that group easily through the hierarchy element. But hierarchy created as consolidation. When we use hierarchy, the number attached to the elements belong to that hierarchy, will be summed up into the consolidation element, otherwise we need to separate the hierarchy.

We can present data based on group of attribute, that also can simplify rule or TI scripting. Instead of check the parent or ancestor in every level, we can read the content of attribute to know which group these elements belong to.

Sample of complicated TM1 Rule

That complicated rule can be simplified by putting attribute to identify group of product, and use this code in the rule formula

If attrs(‘product’,!product’,’group_product’)@=’funding …..

Attribute to clasify group of element

Numeric

Numeric refers to numeric data type. Data stored in the attribute as numeric. Same as string attribute, it is not unique.

We can use the number as a constant multiplier.

For example if there is formula related to product, and each product has its own multiplier, we can use attribute.

[‘budget’,’amount’] = N: [‘xyz’] * attrn(‘product’,!product,’multiplier’);

And still many more.

(Veronika Rotua Gultom)

Multi Purpose Calendar

I need multi purpose calendar where I can see public events, my marketing team strategy plans, etc…

I also need to plan my family holiday and don’t want to miss my team member’s birthday as they are valuable to me.

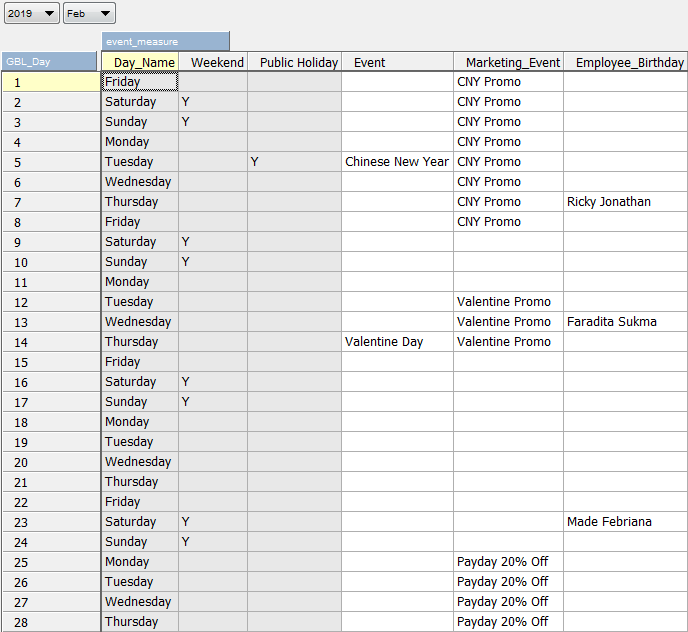
I will go holiday this month on Feb 1 and will be back to work on Wed, Feb 6. So I just need to take two days leave which are Friday (Feb 1) and  Monday (Feb 4).

You know, in Indonesia, there is government policy where employees will get  THR (Tunjangan Hari Raya), it such a bonus or reward for them to celebrate festival like Idul fitri, Christmas, New Year,  Chinese New Year. Usually that’s the time people will shop a lot, like buy a new car, new vehicle, house renovation, etc…so we need to prepare for marketing strategy during that time to get more customers, prepare for the product stock, etc

I had TM1 build it for me 🙂

MultiPurpose Calendar

(VRGultom)

Locking TM1 Cells Based on Parameters

Some scenarios need users to not change any data in a cube based on business rule. In this case the cube should be locked but still can be viewed.

For example in budget cycle there are period of preparation and submission. There must be deadline for preparation and submission. After deadline date reached, business users should be forced to submit the budget. How it can be done in TM1 data modeling?

In TM1 Application once you submit budget, you cannot change data until it is rejected by reviewer/approver. But how if business users not yet submit it? TM1 data modeling should be able to lock it to prevent any changes.

How to lock certain data cells in a cube, unlock and lock it if required using a simple tool that can be done by business user?

I.     Create cube lock setting

Create a cube contain some parameters you want to set. In this sample I set it based on period year, month, and version (data version). Just name it ‘lock_setting’ cube.

The structure will be like this

Year: to identify what year of data

Month: to identify what month of data

Version: to identify what version of data

Status: to define if data is read only or editable. Set it as ‘string’

II. Set the lock status

Let say, we are going to lock budget where the cycle started from July last year to Jun current year.

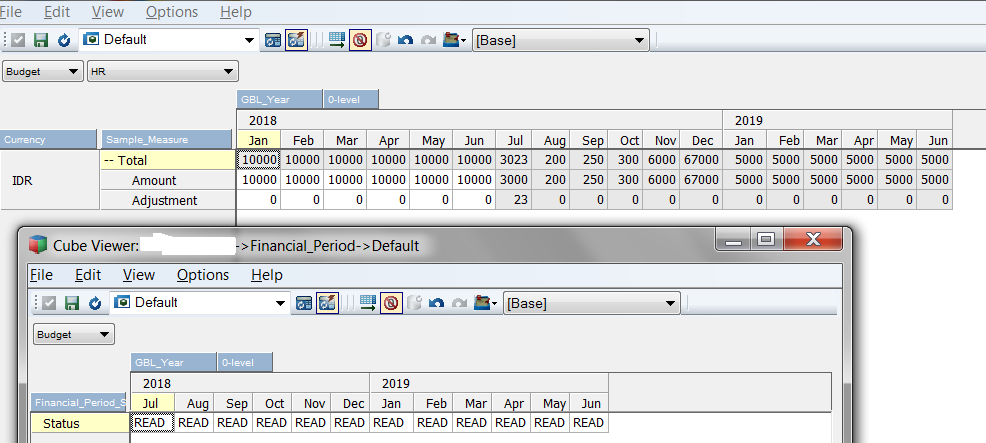
So the setting is like this below picture:

lock_setting_cube

“Read” mean Read only, while blank is editable.

It can be read as: “lock budget data from Jul 2018 to Jun 2019”

III. Create Cell Security Cube

Remember that TM1 security access can be set until cell level. So, to lock cube only for certain data, we can use this feature.

Security cell setting is stored in control cube:

}CellSecurity_[Cube_Name]

The structure cube will be same with the cube [cube_name] plus dimension that listed group of user: }groups

This dimension }Groups is required to define what group of users will be affected by the setting.

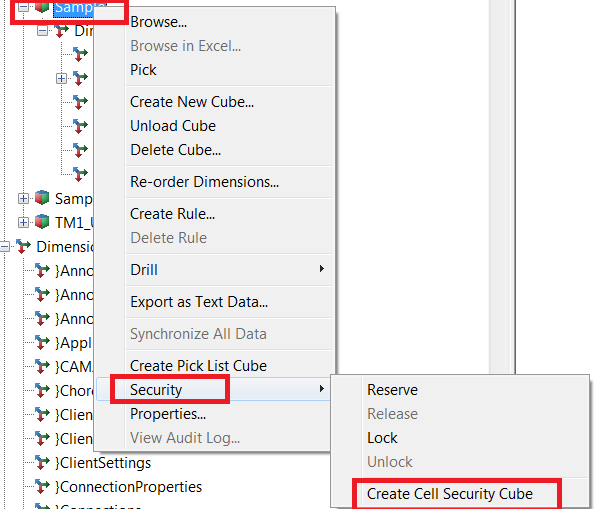
By default the Cell security cube is not there until we set the cell security for the cube. To do that:

  1. Right click cube Name
  2. Security
  3. Create Cell Security Cube
create_cell_security_cube

To be able to see the cube cell security:

  1. Go to view
  2. Display Control Cube
  3. Browse cube: }CellSecurity_CubeName

IV. Create rule to set cell security access

Then we are going to automate the status by taking data from the cube contain setting of lock by period:

lock_setting_cube

And copy the content to cell security cube.

We need to create rule:

[] = S: db(‘lock_setting’,!gbl_year,!gbl_month,!gbl_version,’status’);

As we do not need feeder here, do not need to put skipcheck nor feedstrings.

The rule will affect all of group users. You can put group name if you want it impact to certain group only.

For example:

[‘HR_Group’] = S: db(‘lock_setting’,!gbl_year,!gbl_month,!gbl_version,’status’);

So the security cell setting will only affect the group “HR Group” only.

All of above steps can be done if you have admin privilege.

V. Test the Security Cell Setting

To test the cell security, login as a non-administrator user, and open the cube. You will see cells are locked follow the setting set in ‘lock_setting’ cube.

security_cell_by_Parameter

To be more users friendly, you can create interface in excel to access the cube setting, so it will be easier for user to change the setting based on their requirement (Veronika Rotua Gultom)

Top-Down Budgeting vs Bottom-Up Budgeting in TM1

How to implement Top-Down Budgeting or Bottom-Up budgeting or even both in IBM Planning Analytics?

According to investopedia.com:

In corporate budgeting, a top-down approach would start by setting spending limits at high levels of aggregation, such as total spending for the company as a whole, and possibly also total spending for each line item of expense in its accounting hierarchy. Meanwhile, a bottom-up method also is likely to be underway, with departments or reporting units preparing their own spending wish lists, broken out by line item of expense. More often than not, the latter method will produce higher spending targets than were envisaged under the former, and a reconciliation process will have to occur, to produce a company-wide budget in which all the parts equal the whole.

Read more: Top-Down vs. Bottom-Up | Investopedia https://www.investopedia.com/articles/investing/030116/topdown-vs-bottomup.asp#ixzz5UFoR2yoL

So how it can be implemented in IBM Planning Analytic?

Top-Down Approach

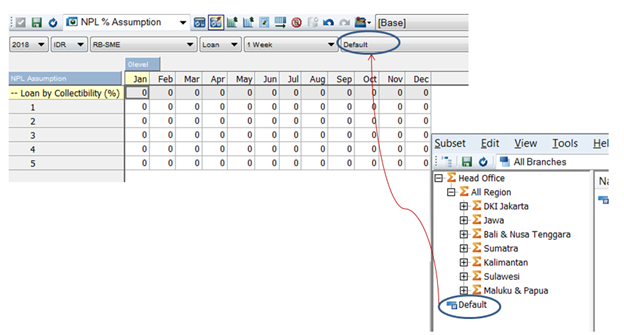
We need a cube to put corporate assumptions to be used by reporting units in preparing their budget. This cube will be updated by the responsible group of users and let reporting units/departments access/read it and use the numbers in the calculation together with the actual from previous period as the baseline to compose the budget. This numbers can be set as global numbers that applicable to all or in lower level such as regions. Or even specific to each department depends on the requirement.

Example:

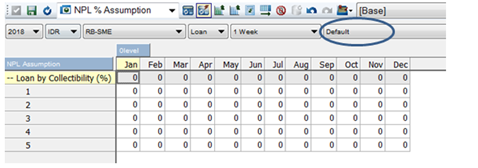
In below picture I set the default value for NPL %. I put it in an element named “default”

So, the value put under element “default” will be global for all.

top_down_sample

If you need to put corporate assumption in lowest level, such as department or branch, you will need to put it by department/branch.

Bottom-Up Approach

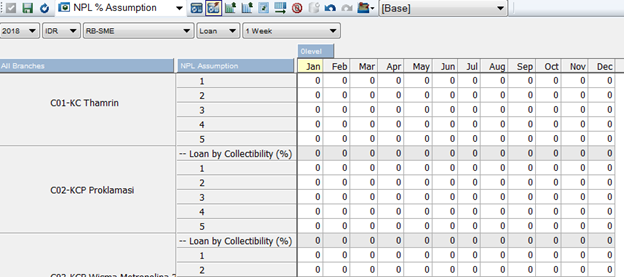
Each department will submit their budget to the corporate management to be approved or rejected. But still there should be standard numbers to compose the budget. The assumption can be set in department/branch level that maintain by themselves

bottom_up_sample

Top-Down and Bottom Up Approach

Sometimes it is required to use both approach, Top-Down and Bottom up budgeting. For example if corporate define the standard % corporate assumption or number to be followed by reporting units/departments, but based on actual history data and some other considerations, department level think they cannot afford it, and need to propose different target, so in this case we will have two numbers:

  1. Corporate assumption
  2. Department/reporting unit proposal

If one branch cannot afford the default number, they can put their number in branch level and do calculation based on the number in branch level. If they want to use standard corporate number, they can use the default number. Just be clear with the business logic, when Reporting Units will use their own number/target, and when they have to follow corporate number/target.

We can use this structure to prepare for both scenarios, top-down and bottom-up budgeting.

bottom_up_top_down_sample

I put the element named “default” in the same dimension for company hierarchy. If the branch level has no number, use default number. Otherwise use the branch level number. If you need to have default number in region level instead of global, you need to have leaf level elements to store default numbers for every region.

If the corporate number set by branch, so you will need two elements measure in the same level to store:

  1. Corporate number
  2. Branch number

Conclusion: We will need two elements to store data set by corporate level and data set by branch/department/reporting unit level. All elements must be leaf level to be able to be input by users. How and where the elements should be? it depends on how the number will be applied in budgeting process. Is it global from corporate to all level in that corporate, or it is specific to region/branches/other levels (VRGultom).


Year over Year Method

According to Investopedia, Year over Year (YOY) is a method of evaluating or analyzing two or more measures events to compare the results at one time period with those of a comparable time on an annualized basis.

This method can be used to know how is the performance on the certain period compares to last year (current year – 1). For example, how is financial performance, sales performance, etc, of this year compare to last year on the same month?

In fact we can compare not only one year period but even 2 years, 3 years, 5 years, and so on, as long as we have data on those years.

For example, we want to compare sales data on Jun 2016 to data on the same month start from five years ago up to current year.

We can create a model like this in TM1 or other dimensional analytic system.

List of dimensions:

  1. Year
  2. Month
  3. Year_Compare
  4. Product
  5. Measure:
    1. Sales_qty
    2. Sales_Price
    3. Sales_Amount

Year dimension contains list of year such as 2016, 2015, 2014, …

Month dimension contain list of months, Jan to Dec

Year_compare dimension contains list of element to store data of  last year data on the same month (Current Year -1), last two year data  (Current Year -2), last three year (current year – 3), etc.

So user can see the number of measures (Sales_qty, Sales_price, and sales amount) in above sample at the same time.

Illustration:


table1_yoy

When the year filter change, the list of year in the table will change follow the year of filter. And the value in the table will change as well.


We can write rule formula to flow data from the year mentioned in the list to the year_compare dimension that can be represented as current year-1, current year-2, current year-3, etc, as shown on below picture.

table2_yoy

And the table can easily be converted into graphic.

Veronika Rotua Gultom

Get Out from Looping Process.

Image

It is programming trick that can be implemented not only in TM1.

So far from some programming languages I know there are three types of looping

  1. For…Next
  2. While…do or Do…while
  3. Repeat…Until

Loop is part of programming to repeat command as many as maximum counter we defined. The difference between above loops explains below.

  1. For…Next

for..next

The counter start from 1 and will stop after i = 10

The iteration is always 1

  1. While…do

while_end

Line 1: i = 1

Meaning the counter start from 1. You can change it into the number you want.

Line 2: While (i<=10)

To check condition before doing the command inside the loop. If (i<=10) execute the commands inside the loop.

Line 3: Write.Output(i)

It is sample command inside the loop. In this sample, it is algorithm command to write output.

Line 4: i = i +1

Is the iteration. Here you can define your own iteration. In this sample I put plus (+) one (1). But you can put any number as the iteration, depend on your requirement.

Line 5: End While

is the “closing” of the loop, to indicate process to go back to the top, the “opening” of the loop.

  1. Do…While

do_while

It is same with while do (number 2). The difference is it will do the commands inside the looping before checking either the counter value still below the maximum number or not.

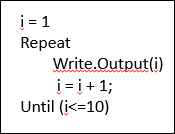
  1. Repeat…Until

repeat_untill

  It is same with do..while (number 3). Repeat to execute commands inside the      looping until the system not meet the condition that defined in “until” section

Now, how to get out from the loop if the maximum number haven’t been reached? Maybe there is another condition that has been met and you don’t want system to continue to do the process until maximum iteration reached.

Sample Case:

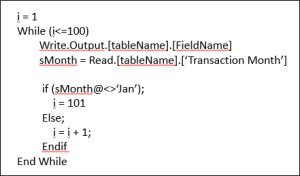
Read data from table maximum 100 times or until transaction Month <>’Jan’

So the looping should be like this:

sample_case

See line 6:  i = 101

by changing the iteration value into 101, the process will stop once it found that the value of “I” is not less than 100.

That is the way to get out from loop before the iteration reached maximum number. Maybe some programming languages have command “exit” to get out of looping, but this is the basic logic.

about the loop, it is also related to this: Simple Concepts of Turbo Integrating Scripting

Veronika Rotua Gultom


Master Data Management (MDM)

From my experiences there are few methods of managing master data that need to be set up at least at the beginning of system implementation.
Even though master data is not transaction data that changes often (that’s why it is called as Master Data), it should be update-able by users. The update is required when the element is no longer required, there is new elements need to be inserted, or change element name. So the update can be:

1. Insert new element
2. Rename the existing element
3. Remove/delete the existing element

1. Insert new data (new element)
What we need?

– New element name
– Description for the new element name (if required)
– Attributes for the new element name (if required)
– Where it will be put? Under what parent? (it is related to hierarchy)

What we need to do?
a. Validation before inserting process
Check if the new name is exist in the list of elements
Check if the aliases name is exist or used by another element (in TM1 alias name     is unique)
Validate the attributes (if required)
b. After validation process
Insert new element
Update Attributes and aliases (if required)
Make sure to put the element under the correct hierarchy

2.  Rename the existing element

What we need?
Existing element Name to be renamed
What we need to do?
a. Validation before renaming process
Check if the new element name is exist
Check if there is data attached to that element
b. Moving data from the old name to the new name
If there is data attached to the old element, it has to be moved to the new element     first before removing the old element. Practically we should not remove/delete any     element from a dimension. Or to be save, we can put the ‘deleted’ data under        specific hierarchy where this hierarchy will not be read in any processes.

3. Delete the existing element
What we need?
Existing element Name to be deleted
What we need to do?

a. Validation before renaming process
Check if the element mentioned is exist
Check if there is data attached to that element
In TM1, data will be lost when element is removed, so we need to make sure there     is no data attached to that element.

b. Moving data from the old name to the new nam

There are some methods I ever worked on regarding this MDM:

1. Insert elements directly by loading data through data source outside TM1 but no need to     keep the data source. So the process will create and update dimension based on data       source loaded to TM1. The data source can be RDBS table or flat file.
2. Insert/update elements based on data on cube source. Cube source become data             source of dimension elements and the data source will be kept in TM1.
3. Using xdi Excel where dimension updated through xdi excel. The original data source         will not be kept in TM1.
4. Manual update: directly copy the list of element and manage the hierarchy manually
(not recommended)

What difference between MDM with data source inside TM1 or not?
If you keep MDM data source inside TM1, you can change data on that cube source. Users find the code that they want to change and do updating process. Here, users can see the complete data elements in one MDM dimension and the whole attributes. They have to choose which data element they are going to update and what thing they want to change. They can change multiple data elements since all element dimension is there. Flexible.
If you the data source is not inside TM1, users have to find the unique code in dimension and system have to provide the data related to that element code for users to be able to do changes. For me this method is more secure since system will only show one element data that requested by users, and users will do changes only to that element data. Less flexibility but more secure.
As mentioned above, Master data is something that will not change daily like transaction data, so it should be ok if it is less flexibility but more secure.

Moving TM1 Model from One Environment to Another Environment

Moving TM1 model from one environment to another environment (different machine)

  1. Copy the data folder
  2. Copy the config file and change necessary setting (host name, IP address, port number)

Those steps are enough to open the model through the various TM1 clients, such as TM1 perspective, TM1 architect, TM1 performance modeler, etc.

To Recreate the TM1 application through TM1 performance modeler you need to clear all ‘settings’ from the old environment.

To do that job, IBM Cognos TM1 has provided a process that you can see as a control object process.

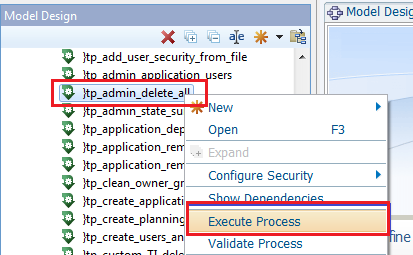
The process name is “}tp_admin_delete_all”.

Just run that process to clear all history brought from the old environment, and the creation or deployment of new application should work.

Here is the step by step:

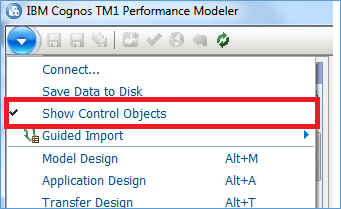
  1. Open TM1 client. Here I use TM1 Performance Modeler.

Make sure that you show the control objects to see the process name

ShowControlObject

  1. Find the process named “}tp_admin_delete_all” and execute the process

ExecuteProcess


VRGultom


Toggle Between TM1 Rule and TI

TM1 formulas can be calculated using TI or rule. TI is more flexible than rule, but it need something to trigger the process such as button that need to be pressed to execute the process or chore to run it base on schedule, while rule is automatically calculate the formula when users browse the cube.

Maybe there was time where we have to change the rules formula become TI, for certain period or condition.

Here is the trick to toggle between TI and Rule

  1. Add attribute in the dimension to indicate whether element on this dimension will be calculated by TI or rule.

Dimension Name: Dimensionx

Dimension Attribute: ‘Rule Calculation’, String

Value will be Y/N, Y for rule calculation, N for TI calculation

  1. Create view for users to update the value of attribute, to toggle between TI and rule calculation.

You can manipulate depend on your requirement, maybe by month, year, or by    element

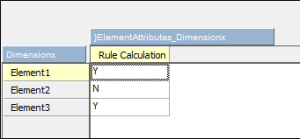
Here is the simplest sample:

RuleCalculation

  1. In the cube rule:

[] = if (attrs(Dimensionx,!DimensionX,’Rule Calculation’)@=’Y’,CONTINUE,STET)

The above formula mean:

For every element check if the attribute value of ‘Rule Calculation’ is ‘Y’, continue to the next formula

And if the value of Rule calculation is not equal to ‘Y’, stet, meaning all the formula after this formula will not be executed, so the TI can be run and put data there. (VRGultom)