
According to Investopedia, Year over Year (YOY) is a method of evaluating or analyzing two or more measures events to compare the results at one time period with those of a comparable time on an annualized basis.
This method can be used to know how is the performance on the certain period compares to last year (current year – 1). For example, how is financial performance, sales performance, etc, of this year compare to last year on the same month?
In fact we can compare not only one year period but even 2 years, 3 years, 5 years, and so on, as long as we have data on those years.
For example, we want to compare sales data on Jun 2016 to data on the same month start from five years ago up to current year.
We can create a model like this in TM1 or other dimensional analytic system.
List of dimensions:
- Year
- Month
- Year_Compare
- Product
- Measure:
- Sales_qty
- Sales_Price
- Sales_Amount
Year dimension contains list of year such as 2016, 2015, 2014, …
Month dimension contain list of months, Jan to Dec
Year_compare dimension contains list of element to store data of last year data on the same month (Current Year -1), last two year data (Current Year -2), last three year (current year – 3), etc.
So user can see the number of measures (Sales_qty, Sales_price, and sales amount) in above sample at the same time.
Illustration:
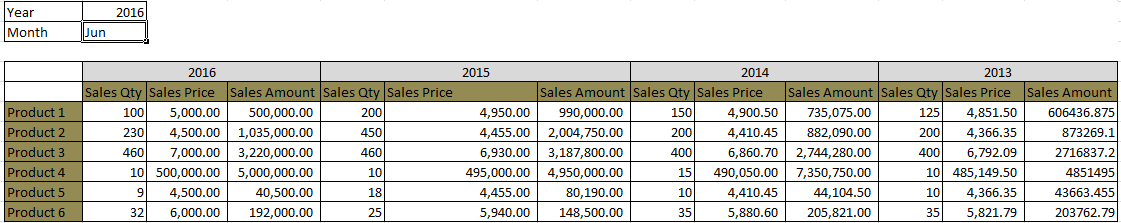
When the year filter change, the list of year in the table will change follow the year of filter. And the value in the table will change as well.
We can write rule formula to flow data from the year mentioned in the list to the year_compare dimension that can be represented as current year-1, current year-2, current year-3, etc, as shown on below picture.

And the table can easily be converted into graphic.
Veronika Rotua Gultom
